Doruk Alkan

Skills
- SQL | Postgres, MySQL, SQL Server
- Python | Pandas, NumPy, Matplotlib, Seaborn
- BI & Visualization | Power BI, Tableau, Excel
Education
B.A., Linguistics @ Boğaziçi University (February 2025)
Databel Customer Churn Analysis
Overview
Project description
This is an Excel project that investigates a dataset from an example telecommunications company Databel and analyzes their churn rates. Churn is a significant business metric that is relevant for various industries, including the telecommunications sector which operates with a subscription-based model. Managing customer relations and minimizing churn is an ongoing process for businesses. In this project, churn is analyzed to figure out:
- What is the overall churn rate?
- Why are customers churning?
- Which customers are churning?
- How to reduce churn?
I’ve addressed these questions by creating calculated fields, building PivotTables, and creating a dashboard to communicate insights.
Executive summary
Key findings include:
➡️ High overall churn
Churn rate is 26,86% among 6,687 customers, indicating that more than one in four customers are canceling their subscriptions.
➡️ Churn drivers
Competition and subpar customer service are the leading causes.
➡️ Demographic insights
Senior citizens are identified as the most likely group to churn.
➡️ Plan & data usage patterns
Detailed investigation indicates that customers with unlimited plans who consume less than 5 GB of data are at higher risk of churn.
➡️ Actionable recommendations
The dashboard combines these insights into clear visualizations, and the last section guides potential business strategies to reduce churn.
Table of contents
- About dataset
- Data preparation
- Exploratory data analysis
3.1. Churn reasons
3.2. Demographics
3.3. Age groups
3.4. Plan types
3.5. International calls
3.6. Contract type and length - Dashboard
- Insights & recommendations
1. About dataset
The dataset used for this project is a fictitious dataset taken from DataCamp.
- A single table consisting of 29 columns
- One row per customer
- Snapshot of the database at a specific moment in time (i.e. there’s no time dimension)
Columns contain information regarding demographics (age, gender), international plan details (plan, activity status, calls, minutes used, extra charges), data usage details (unlimited data plan, average monthly download, extra charges), and other details (account length, contract type, payment method). These details provide useful metrics while analyzing churn from various perspectives.
2. Data preparation
The initial step included cleaning the dataset to remove duplicates and handle records that contain missing values. Then I proceeded to create a new column named Churned and assigned 1 or 0 to each customer based on whether they canceled their subscription or not, which allowed me to easily calculate the churn rate during the analysis stage.
3. Exploratory data analysis
I began exploring the dataset by creating a pivot table that displays the total number of customers, number of churners, and a churn rate calculation.
- There are 6687 customers total
- 1796 customers have churned
- Churn rate is 26,86%
3.1. Churn reasons
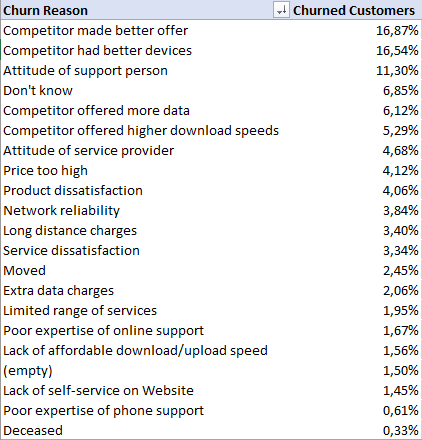
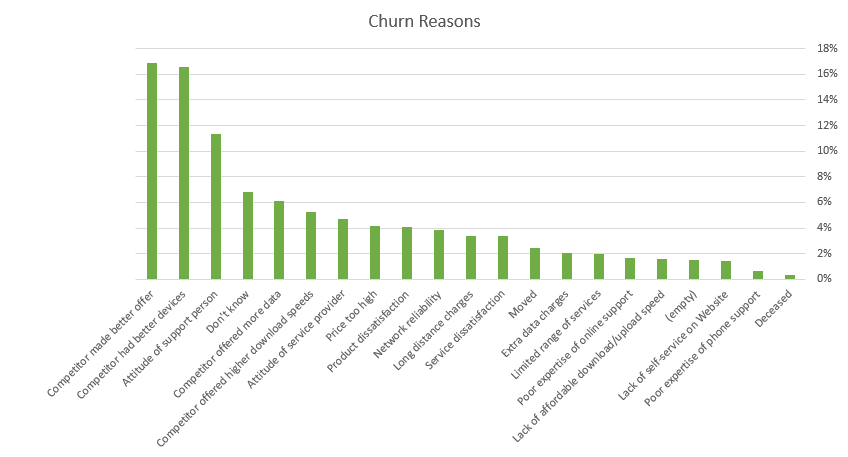
As the churn rate at 26,86% is relatively high, the next step is to investigate why this is the case. I’ve created a pivot table displaying churn reasons and % of churned customers, and a bar chart to visualize them.
The most popular reason for churn results from competition, and customer service shouldn’t be overlooked.
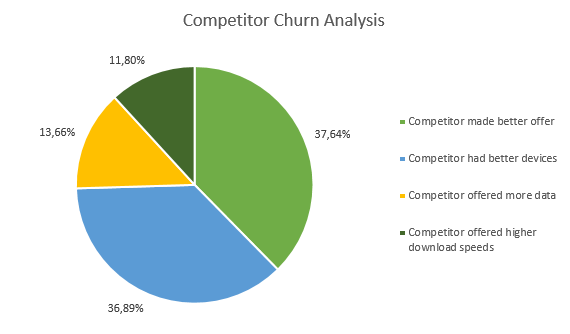
This led me to examine competition-related churn more closely: I’ve created another pivot filtering by churn reason category and a pie chart.
Results of my initial exploratory analysis naturally raised the question:
💭 Is Databel competitive enough?
But there are still many columns unexplored before attempting to answer this question. Churn patterns can be further analyzed by focusing on demographics, age groups, plan types, and contract types.
3.2. Demographics
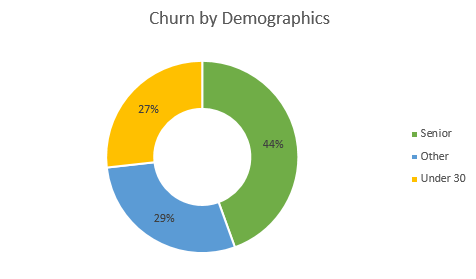
The dataset categorizes individuals by age in three separate columns: Under 30, Senior, and Other. This required me to create a new column to see demographic groups in a single field and add a calculated field to see their churn.
🚨 Senior citizens churn the most.
3.3. Age groups
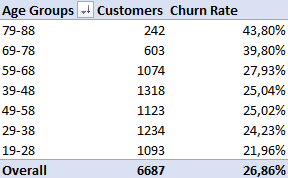
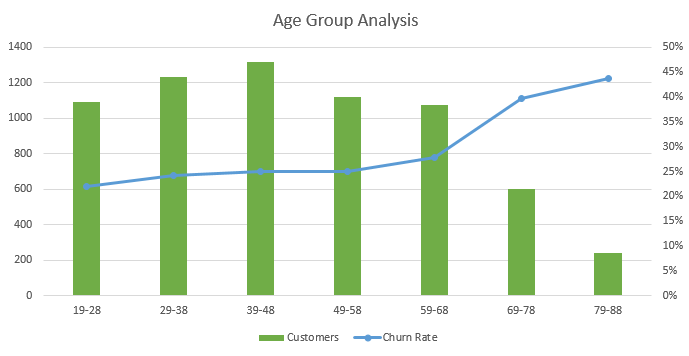
I’ve looked into age dimension more closely to check whether there’s a pattern or not. I’ve used a pivot table grouping ages by bins of 10, then created a clustered column - line chart.
Looks like churn rate gets higher as age group gets older, and older customers have the highest churn rate while being the smallest group.
3.4. Plan types
I’ve investigated how plan types influence churn by focusing on limited and unlimited mobile data plans. I had a hypothesis that people who are not on an unlimited data plan would be more likely to churn, but my preliminary exploration revealed the opposite: people on unlimited plan had a churn rate of 32,11% while people who are not had 16,10%.
🔍 Contrary to my hypothesis, unlimited mobile data plan has higher churn.
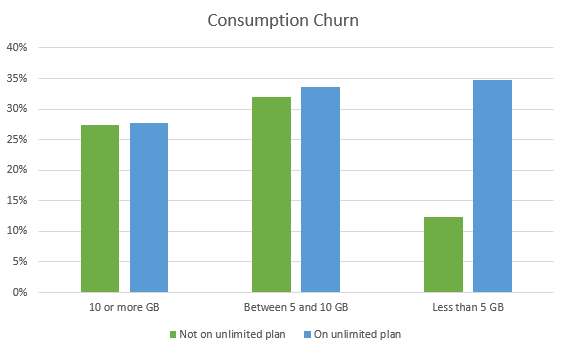
To examine if this churn is related to the amount of internet usage, I’ve created a new column named Data Consumption using a nested IF statement.
=IF([@[Avg Monthly GB Download]] < 5,
	"Less than 5 GB",
	IF([@[Avg Monthly GB Download]] >= 10,
	"10 or more GB",
	"Between 5 and 10 GB"))
🚨 Individuals subscribed to unlimited plan who consume less than 5 GB of monthly mobile data are the most likely to churn.
3.5. International calls
An initial look at international calls has shown that there is not a drastic difference between international and non-international plans.
- International plan churn: 24,88%
- Non-international plan churn: 27,07%
I’ve then looked into this filtering by state, and applied conditional formatting to highlight the states with the highest churn rates. This has revealed that:
🚨 California, Indiana, and New Hampshire are the top three states that have peak international plan churn, with over 60% churn rate.
3.6. Contract type and length
The company offers several contract types:
- Month-to-Month contract
- 1-Year contract
- 2-Year contract
I’ve explored how different contracts and account length influenced churn the most. Understandably so, Month-to-Month contracts and 1-year accounts have displayed the highest churn, and churn rate decreases as account length increases. But the more interesting finding has been that:
🔍 Customers between 3-4 year mark are much more likely to churn on a 1-year contract compared to 2-year contract.
4. Dashboard
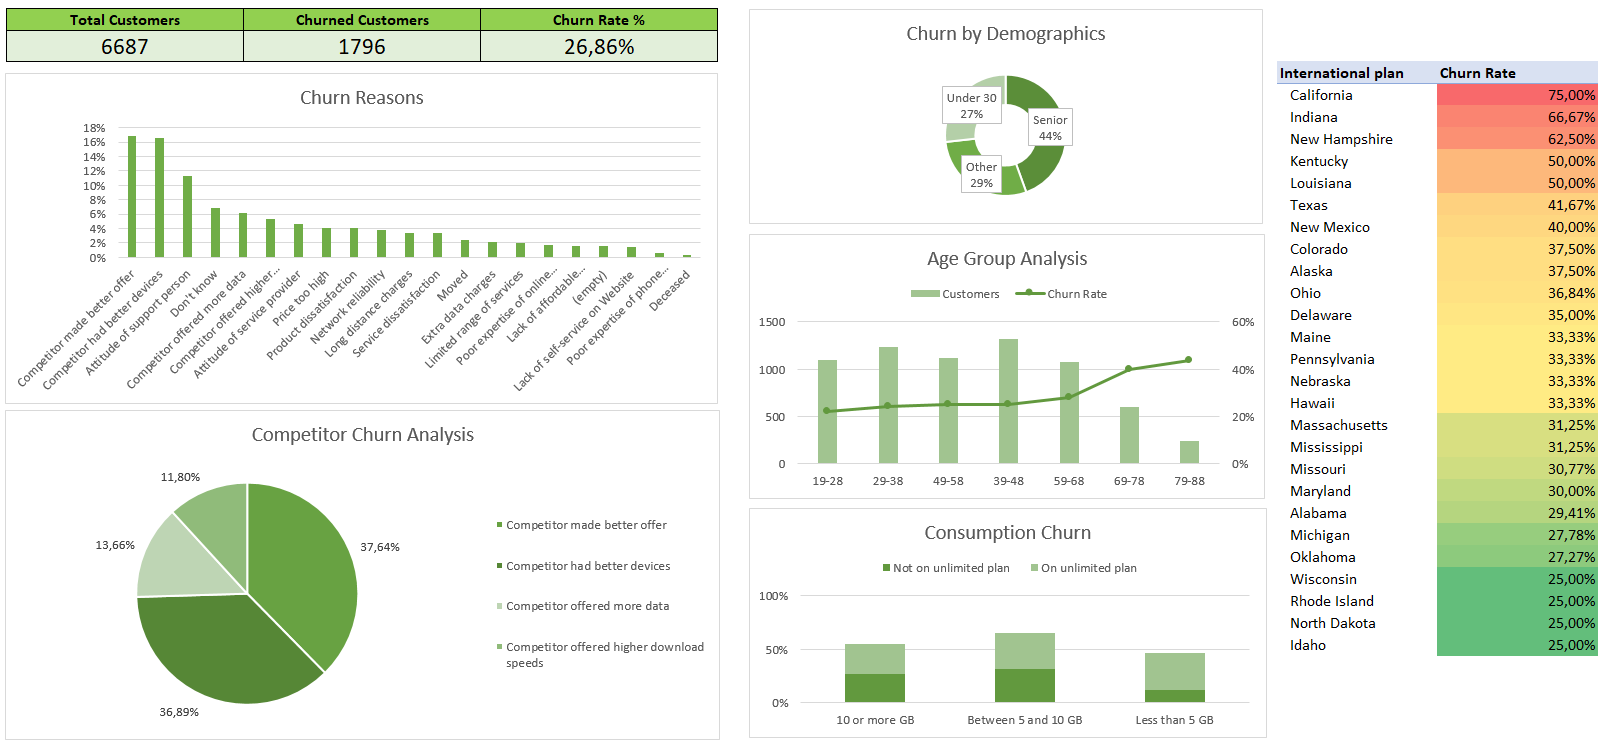
Lastly, I’ve built a dashboard by bringing together relevant tables and charts, and added key information such as:
- KPIs: total customers, number of churned customers, churn rate
- Churn reasons
- Demographics
- Data consumption
- Churn rate by state
5. Insights & recommendations
📌 High overall churn
The overall churn rate is 26,86%, meaning that more than one in four customers are canceling their subscriptions.
Recommendation: Gather customer feedback to further analyze key drivers behind this churn rate.
📌 Lack of competitive edge
Competition and subpar customer service are major factors contributing to high churn rate.
Recommendation: Compare the company’s offers with competitors’ to identify weak points and improve customer service.
📌 Senior customer churn
Senior citizens are particularly prone to canceling their subscriptions.
Recommendation: Develop dedicated support channels and tailored offers targeting senior customers.
📌 Unlimited data plans
Customers on unlimited mobile data plans exhibit a churn rate of 32,11%, which is higher than those on limited plans, with low data usage (<5 GB) being the driving factor for this churn.
Recommendation: Review the pricing and structure of unlimited data plans to adjust it based on customer needs.
📌 Contract types
Month-to-month and 1-year contracts experience higher churn, with a noticable spike for accounts around 3-4 year mark.
Recommendation: Improve contract renewal strategies with special offers for customers close to critical renewal periods.
📌 High-churn states
Some states such as California, Indiana, and New Hampshire display over 60% churn rate for international plan subscribers.
Recommendation: Investigate regional market conditions and provide localized services in high-churn states.
